Statistical Analysis on the Impact of City Walls on Urban Expansion in Zhengding
Methods / Tools
Data Sources
Zhengding (正定) is a small historic city in North China, which was first established in the 7th century and grew into a regional centre. In the early 20th century, the city’s economic and political status dramatically declined due to the detour of major railway routes. The built-up area within the city walls of Zhengding shrank significantly as a consequence. Later, as a result of the economic reform in China in the 1980s, the city sprawled rapidly in the following decades, which is the particular focus of this analysis.
The current city walls of Zhengding was first constructed in the Ming Dynasty (15th century). They have always play the crucial role of defending the city’s security since then, until the mid-20th century. Although after the foundation of PRC in 1949, several sections of the city walls were demolished for new traffic routes, most of them remained roughly intact.
The city of Zhengding started its urban sprawl after the economic reform in China in the 1980s, during which the hindering impact of city walls became more and more prominent.
This analysis, focusing on four representative temporal cross-sections, 1966, 1992, 2008, and 2024, aims to understanding how the city walls has impacted the urban growth in Zhengding.
The data derived from the previous analysis on the urban network of Zhengding and its growth (see the analysis →). The Space Syntax measurement of Axial Synergy (AS) was used to indicate the extent to which the built-up area inside and outside Zhengding’s city walls were divided.
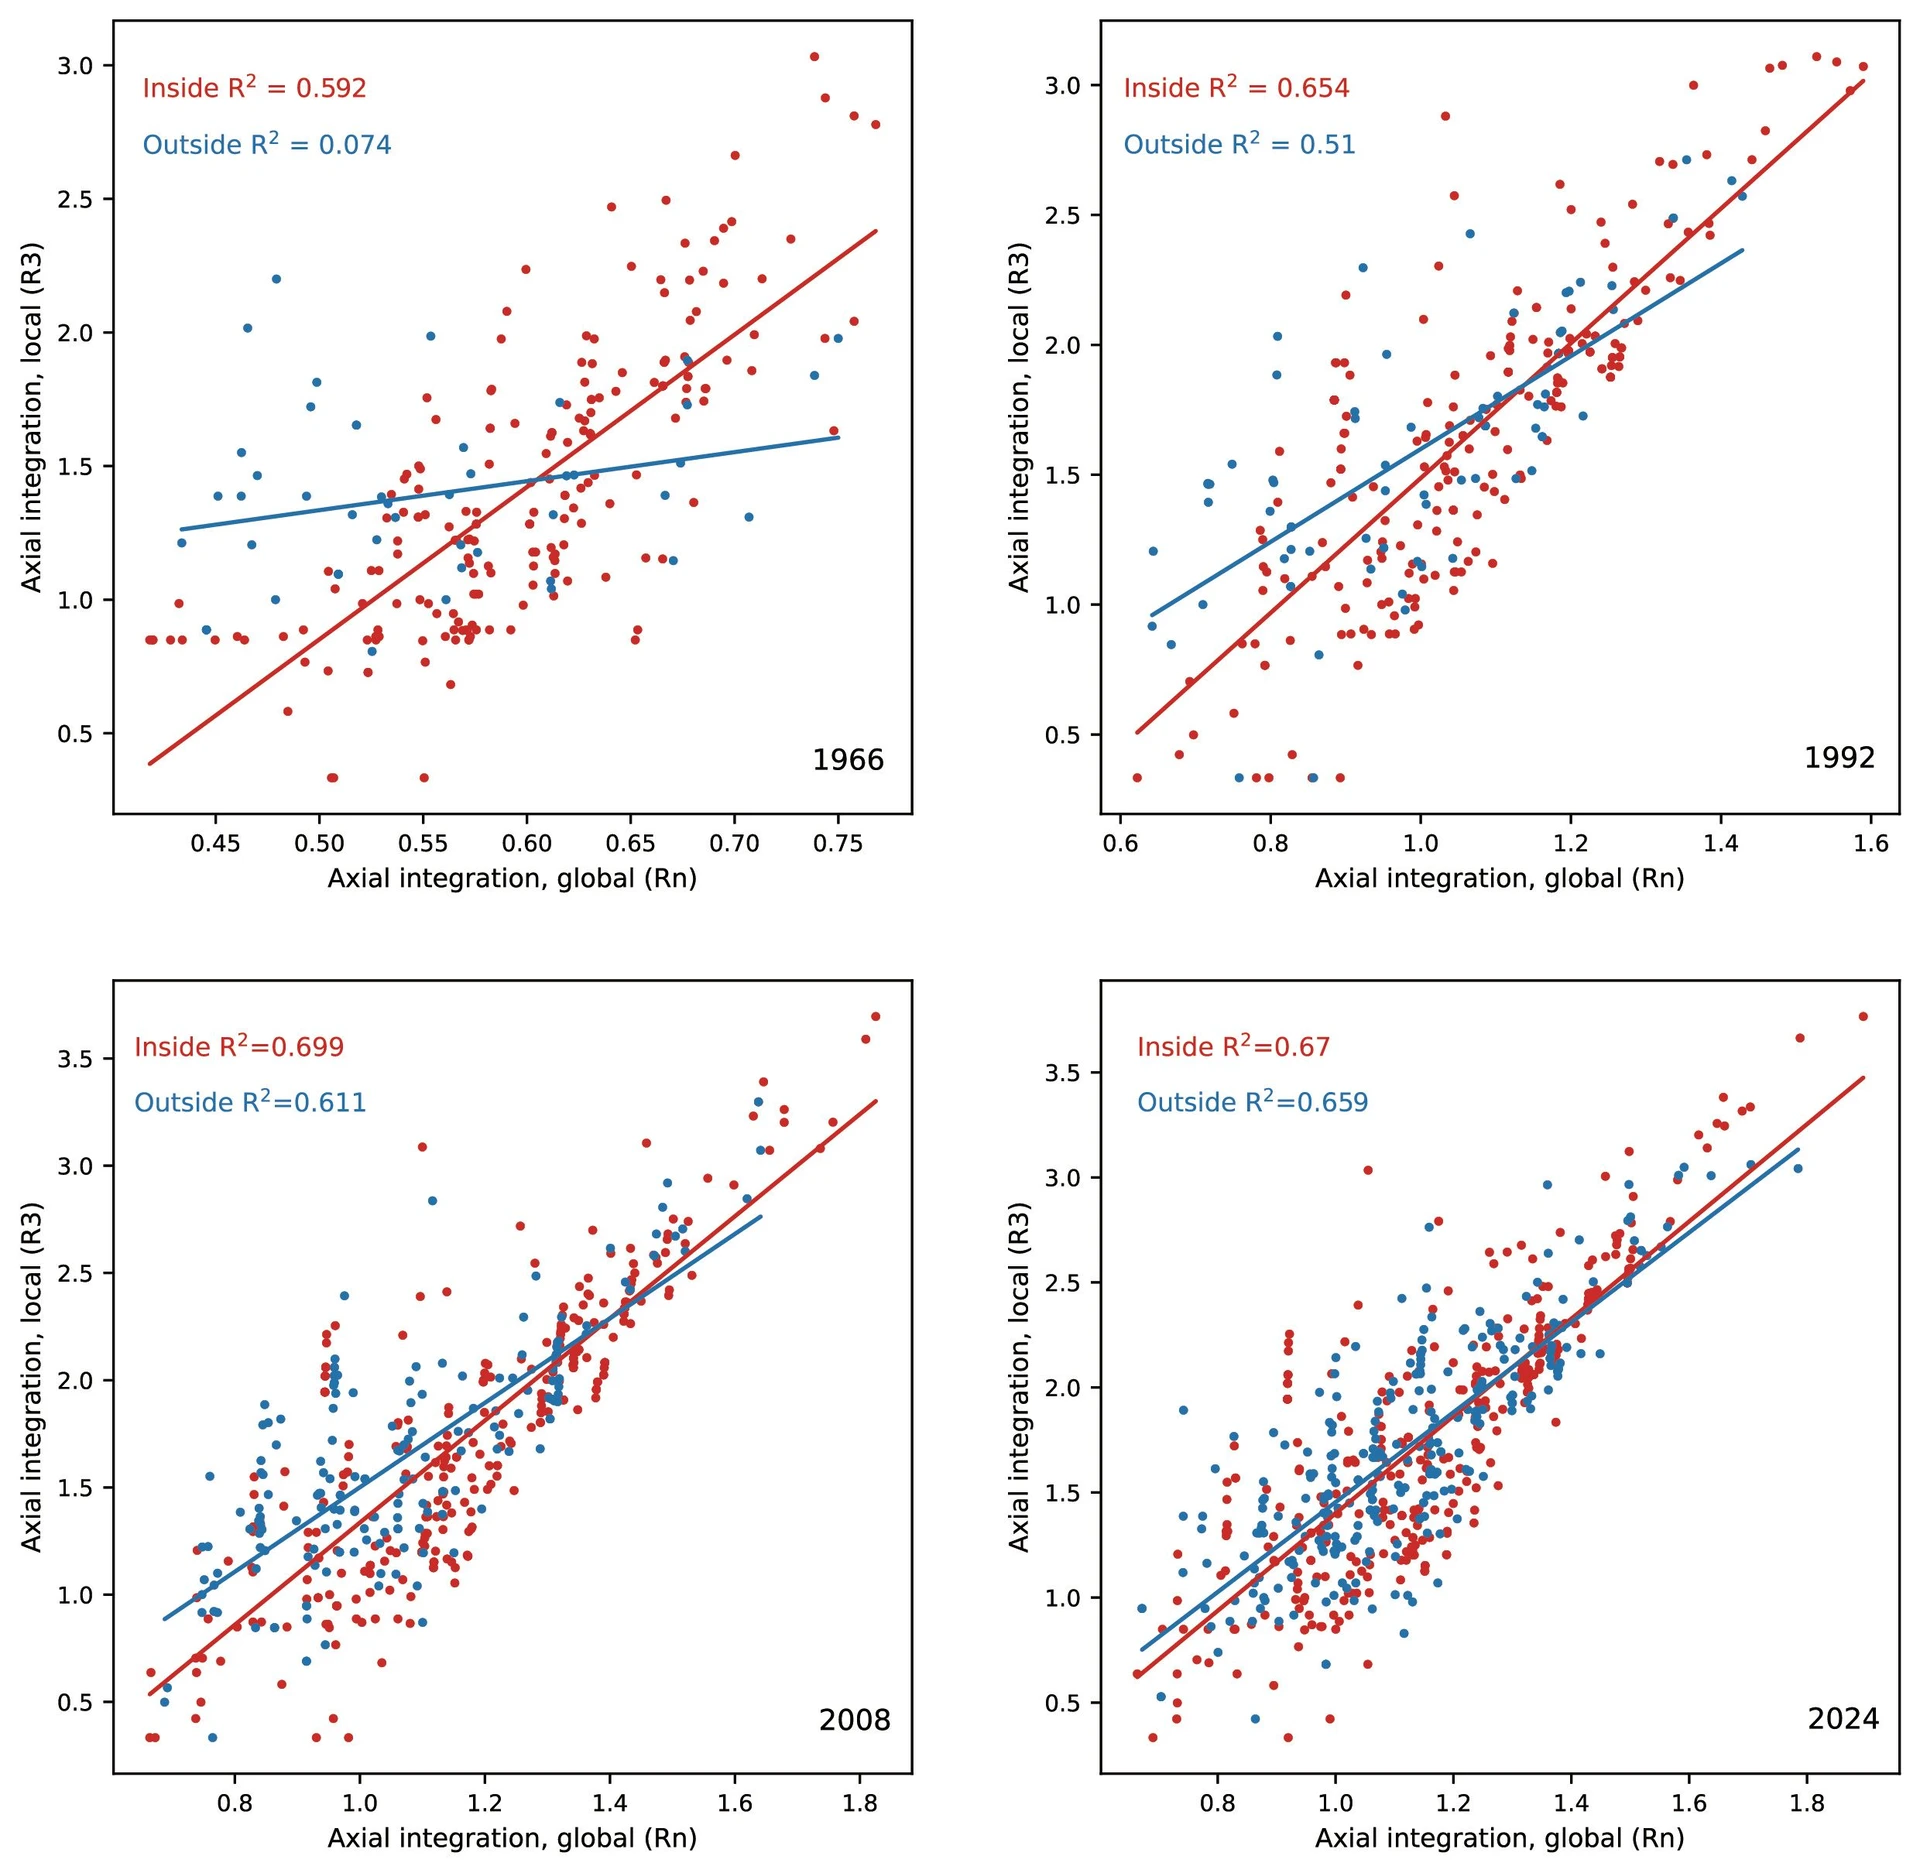
A regression analysis was carried out between the calculation results of axial integration on global scale and on R3 scale to calculate the AS. Python data analysis libraries were used, including Pandas for basic manipulation of CSV datasets, SciPy for regression analysis, and Matplotlib for data visualisation.
Results are shown in the following figures:
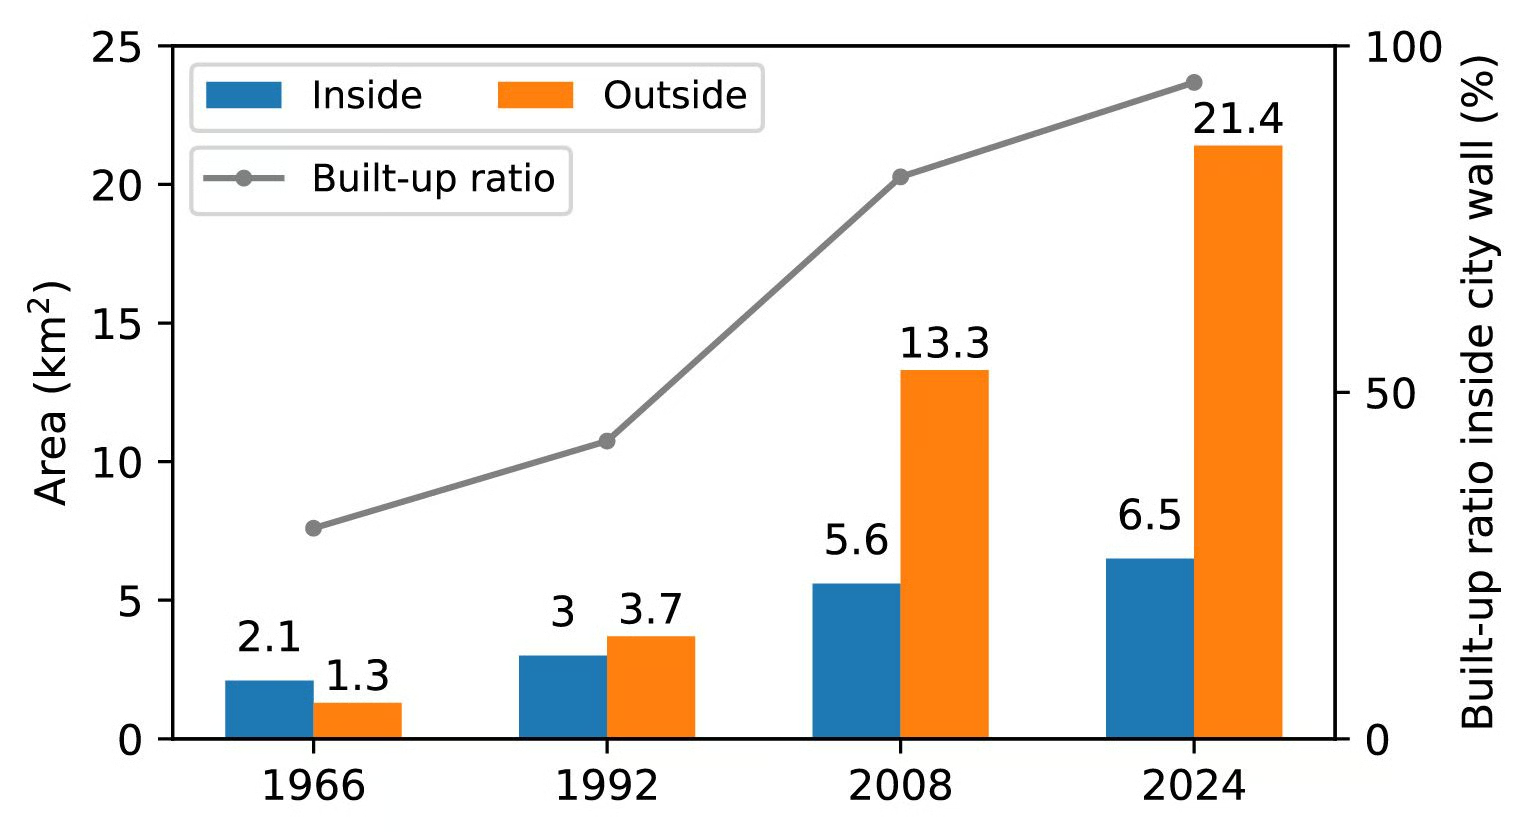
On the left: Basic statistics of the built-up area of Zhengding, illustrating the urban sprawl, especially the outside gradually becoming the majority.
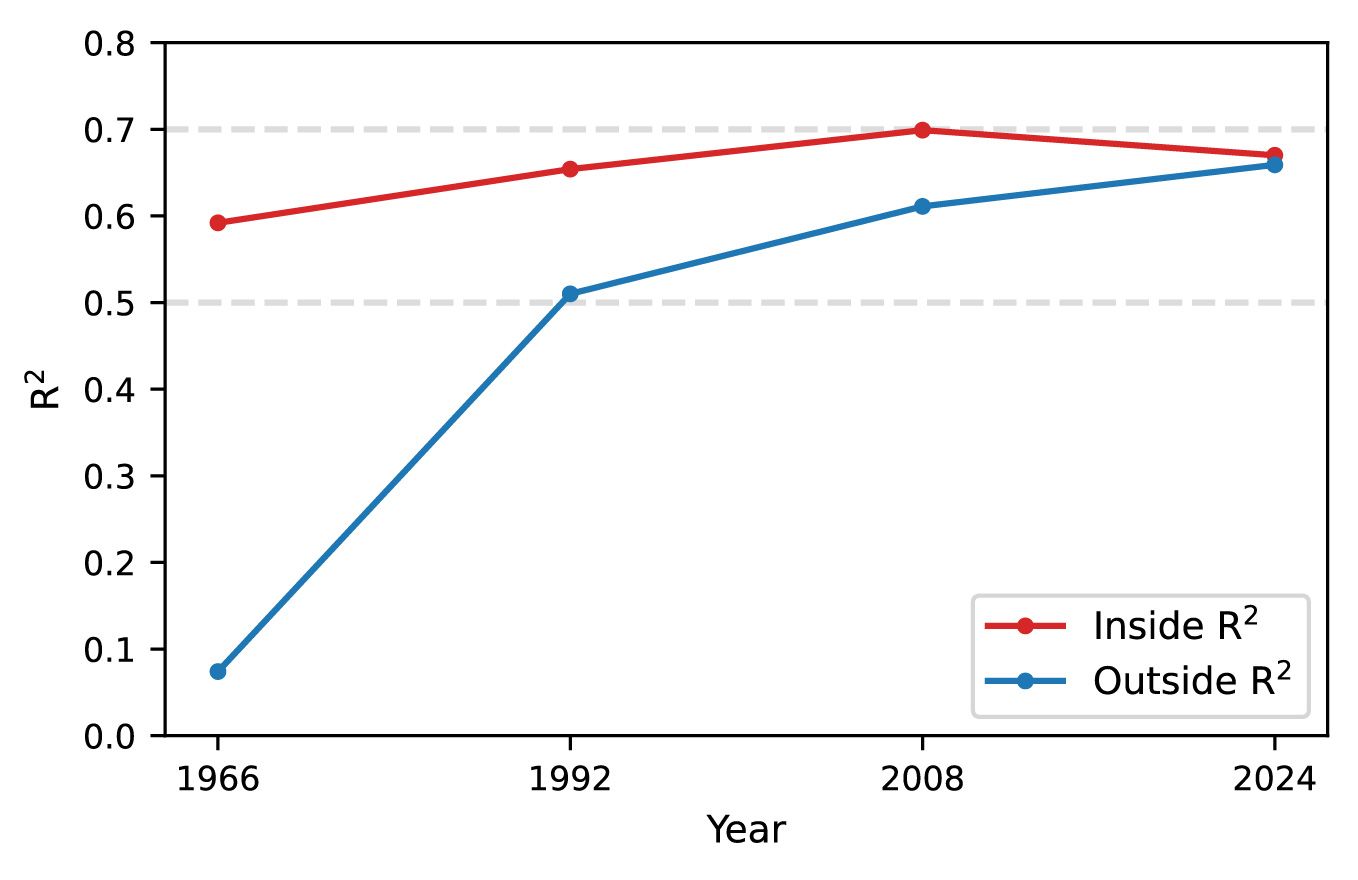
Below: Axial Synergy of Zhengding in the four years. The R2 values between global Axial Integration and R3 Axial Integration of each year represent the Axial Synergy. The figure indicates that the built-up area inside and outside the city walls got more integrated rather than divided with the process of urban growth.
On the right: comparison between the R2 values inside and outside the city walls in the four years, showing better integration between the two parts of the city.